
You can view the manuscript as a html file or a pdf file.
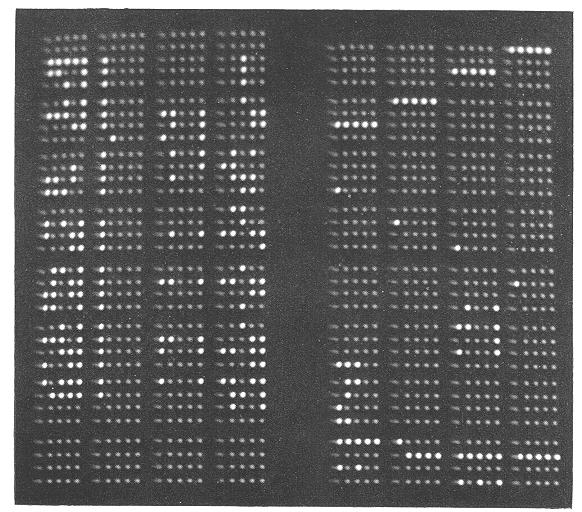
Figure 1. (a) Photograph of a Kilburn--Williams cathode ray storage tube showing the contents of storage locations (left-hand side) // to £/, a segment containing instructions, and (right-hand side) /E to £E, comprising constants, work space and addressing information; (b) alphabetic representation in `Coding Sheet' form. (Adapted from the Programmer's Handbook, 1952 Edition).
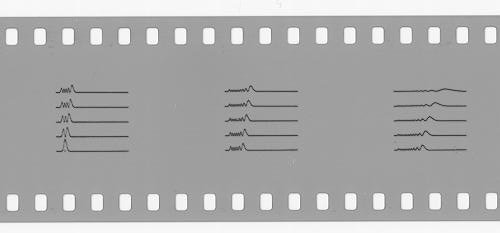
Figure 2. A 35 mm film strip showing Morse wave functions for the 15 vibrational levels of H2 over the range -0.6 < (r-re) < 4.4 Angstrom; the final composite diagram is Figure 1 of Reference 20.
Figure 3. Photographic superposition of contours for an approximate wave function for the ground state of H2+ (dots) on hand-drawn contours for the exact wave function, taken from Reference 21; the completed diagram is Figure 1 of Reference 18.