SSEM Figs. 1 - 2
Index of figures for the 1951 I.E.E. paper on the SSEM
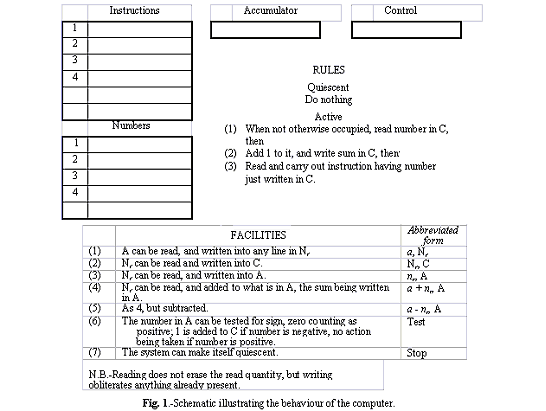
- Fig. 1
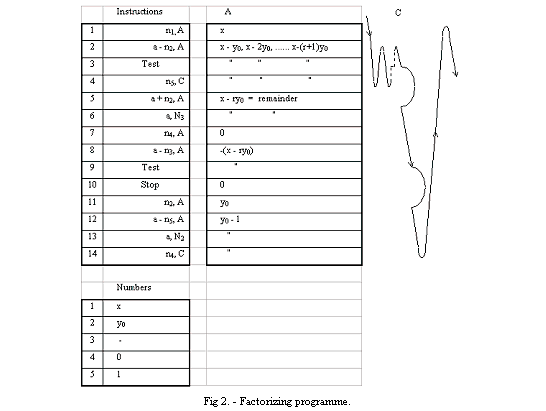
- Fig. 2
- Fig. 3
- Fig. 4
- Fig. 5
- Fig. 6
- Fig. 7
- Fig. 8
- Fig. 9
- Fig. 10
- Fig. 11
- Fig. 12
- Fig. 13
- Fig. 14
- Fig. 15
- Fig. 16
- Fig. 17
- Fig. 18
- Fig. 19
- Fig. 20
- Fig. 21
- Fig. 22
The figures are spread over 6 pages, grouped as 1 and 2 on this page, then 3 to 8, 9-11, 12-14, 15-17, 18-22. If you find you want to study both the text and the figures at the same time, I suggest you open a second browser instance to show this page, and juggle the position and size of the windows on your screen as best you can to minimise overlap (without making the text too strung out!). Then when you want to see both text (on the first window) and figure (on the second) at the same time, click on the link for the appropriate figure in the index above rather than in the text (and return to the index when you have finished with the figure). The figures are all more or less the same size, and you can afford to hide some of each margin! (I can't see how to do it using frames in a way that would be flexible enough.)
The figures below, from the 1951 I.E.E. paper on the SSEM, are reproduced by permission of the Institution of Electrical Engineers